
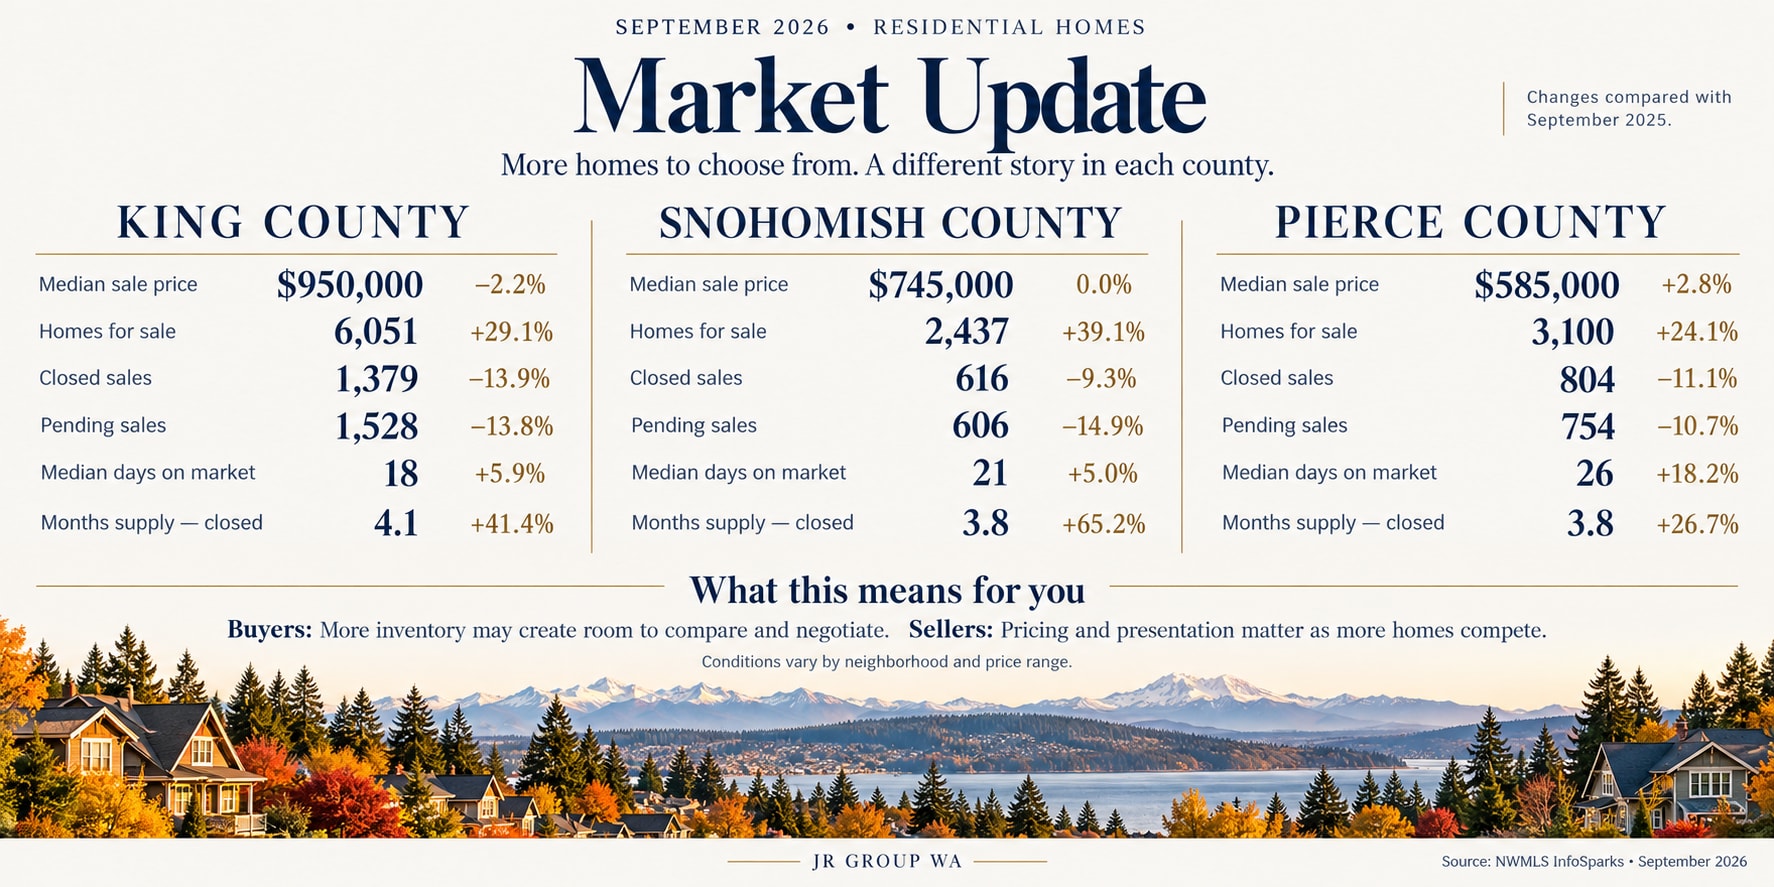

More homes for sale. So why aren’t prices falling everywhere?
September 2026 residential market update | King, Snohomish & Pierce counties
More homes are on the market, and fewer are going under contract. You might expect prices to fall, but September’s numbers show that the answer depends on where you look.
| County | Homes for sale | Pending sales | Median days on market | Median sale price |
|---|---|---|---|---|
| King | 6,051 · ↑29.1% | 1,528 · ↓13.8% | 18 · ↑5.9% | $950,000 · ↓2.2% |
| Snohomish | 2,437 · ↑39.1% | 606 · ↓14.9% | 21 · ↑5.0% | $745,000 · Unchanged |
| Pierce | 3,100 · ↑24.1% | 754 · ↓10.7% | 26 · ↑18.2% | $585,000 · ↑2.8% |
Residential homes, excluding condominiums. Changes compare September 2026 with September 2025.
Why can inventory rise without prices falling?
More listings give buyers more options, but inventory alone doesn’t determine what homes sell for.
The median sale price also reflects which homes sold that month. A greater share of higher-priced sales can lift the median even while other listings sit longer or reduce their prices. These figures don’t tell us how much of each county’s price change came from that mix.
Inventory patterns differed, too. New listings rose 11.6% in King and 19% in Snohomish, but were essentially flat in Pierce. Pierce’s inventory still grew, alongside fewer sales and longer selling times.
The shared pattern: buyers had more choices, fewer homes went under contract, and homes took longer to sell.
For buyers: more options may create negotiating room.
Depending on the home, you may be able to negotiate price, repairs, or closing-cost assistance. But more inventory doesn’t guarantee a discount from asking.
The median sale-to-list-price ratio was 100% in Snohomish and Pierce, and 98.9% in King. Those figures use the asking price at the time of sale, which may already have been reduced.
Compared with the original asking price, the median ratios were lower: 97.4% in King, 97.6% in Snohomish, and 98% in Pierce. That suggests pricing adjustments played a role, but it doesn’t tell us how many homes had reductions or how much buyers negotiated after making an offer.
Our advice: compare a home’s current price with recent comparable sales. A large price cut alone doesn’t make it a good value.
For sellers: steady prices don’t mean you can skip the preparation.
Even in Pierce, where the median price rose, pending sales fell 10.7% and median days on market increased to 26 days, up from 22 a year earlier.
Buyers have more alternatives, so your price, condition, and presentation need to hold up against the competition. Watch which comparable homes are going under contract, not just what other sellers are asking.
Start with a supported price, build flexibility into your timeline, and use showing activity and feedback to assess how buyers are responding.
For homeowners: the county median isn’t your home’s value.
A lower median in King doesn’t mean every home lost value. A higher median in Pierce doesn’t mean every home gained.
If you’re staying put, these numbers provide context. Recent comparable sales, your home’s condition, and demand in your neighborhood are more useful for understanding where your property stands.
If you’re weighing a move—or simply want a clearer picture of your home’s value—we’re happy to help you interpret the local numbers and what they mean for your plans.
Kim Chinn + Joel Ramos | JR Group
Source: NWMLS InfoSparks, September 2026 residential data compared with September 2025. Conditions vary by neighborhood and price range.